
L2 SIRAL Mode Monitoring |
IPF Baseline: | Phase: |
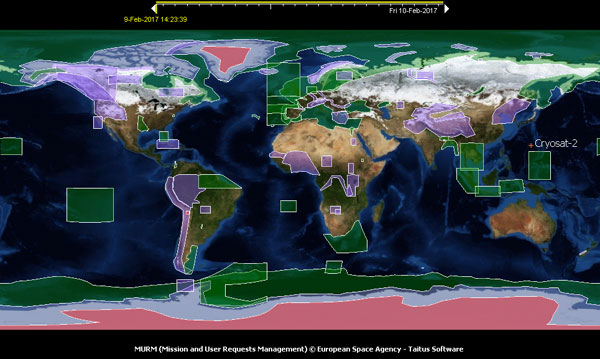
The operational geographical mode mask is updated weekly (every Monday at 00:00 UCT), primarily to account for changes in sea-ice extent, and
we therefore expect to mainly observe changes in the SAR/LRM mode extent between data takes in areas of sea-ice.
Note that for 30 day data takes, the mode mask will normally change during the data take period and therefore some areas will have a mixed mode.
This tool provides statistics and global and polar map plots of the SIRAL mode for each 7-day and 30-day data take. 7-day data takes are aligned to the mode mask change dates.
| Select Data Take Period: | View Global Trend |
Operational Phase (Baseline-D)
| Data take | Timespan | %LRM SAR SARin Unk | Global Map | North Polar | South Polar |
|---|---|---|---|---|---|
| 133 | 21/8/21 -> 19/9/21 | 67.52 / 19.54 / 12.92 / 0 | View | View | View |
| 132 | 22/7/21 -> 20/8/21 | 66.83 / 19.83 / 13.32 / 0 | View | View | View |
| 131 | 22/6/21 -> 21/7/21 | 66.71 / 19.99 / 13.28 / 0 | View | View | View |
| 130 | 23/5/21 -> 21/6/21 | 66.68 / 20.06 / 13.25 / 0 | View | View | View |
| 129 | 23/4/21 -> 22/5/21 | 66.87 / 19.79 / 13.32 / 0 | View | View | View |
| 128 | 24/3/21 -> 22/4/21 | 67.51 / 19.36 / 13.12 / 0 | View | View | View |
| 127 | 22/2/21 -> 23/3/21 | 67.6 / 19.08 / 13.3 / 0 | View | View | View |
| 126 | 23/1/21 -> 21/2/21 | 67.53 / 19.25 / 13.21 / 0 | View | View | View |
| 125 | 24/12/20 -> 22/1/21 | 66.92 / 19.95 / 13.11 / 0 | View | View | View |
| 124 | 24/11/20 -> 23/12/20 | 66.17 / 20.48 / 13.33 / 0 | View | View | View |
| 123 | 25/10/20 -> 23/11/20 | 66.31 / 20.22 / 13.46 / 0 | View | View | View |
| 122 | 25/9/20 -> 24/10/20 | 67.04 / 19.69 / 13.25 / 0 | View | View | View |
| 121 | 26/8/20 -> 24/9/20 | 67.28 / 19.68 / 13.02 / 0 | View | View | View |
| 120 | 27/7/20 -> 25/8/20 | 66.7 / 19.79 / 13.5 / 0 | View | View | View |
| 119 | 27/6/20 -> 26/7/20 | 66.78 / 19.95 / 13.26 / 0 | View | View | View |
| 118 | 28/5/20 -> 26/6/20 | 66.66 / 20.12 / 13.21 / 0 | View | View | View |
| 117 | 28/4/20 -> 27/5/20 | 66.84 / 19.99 / 13.15 / 0 | View | View | View |
| 116 | 29/3/20 -> 27/4/20 | 67.25 / 19.44 / 13.3 / 0 | View | View | View |
| 115 | 28/2/20 -> 28/3/20 | 67.69 / 19.06 / 13.23 / 0 | View | View | View |
| 114 | 29/1/20 -> 27/2/20 | 67.78 / 19.04 / 13.17 / 0 | View | View | View |
| 113 | 30/12/19 -> 28/1/20 | 66.79 / 20.01 / 13.19 / 0 | View | View | View |
| 112 | 30/11/19 -> 29/12/19 | 65.82 / 20.84 / 13.32 / 0 | View | View | View |
| 111 | 31/10/19 -> 29/11/19 | 66.39 / 20.39 / 13.2 / 0 | View | View | View |
| 110 | 1/10/19 -> 30/10/19 | 66.92 / 19.99 / 13.08 / 0 | View | View | View |
| 109 | 1/9/19 -> 30/9/19 | 67.19 / 19.54 / 13.26 / 0 | View | View | View |
| 108 | 2/8/19 -> 31/8/19 | 66.58 / 20.16 / 13.25 / 0 | View | View | View |
| 107 | 3/7/19 -> 1/8/19 | 66.42 / 20.43 / 13.14 / 0 | View | View | View |
| 106 | 3/6/19 -> 2/7/19 | 66.29 / 20.45 / 13.25 / 0 | View | View | View |
| 105 | 4/5/19 -> 2/6/19 | 66.87 / 20.38 / 12.74 / 0 | View | View | View |
Note: data takes may be missing if they have not been processed by this IPF Baseline-D